


Silver Price Forecast: XAG/USD falls to near $58.00 on hawkish Fed sentiment
- Silver faces challenges as expectations grow for tighter Federal Reserve monetary policy.
- Markets price in a 65% chance of a September Fed rate hike, pressuring non-yielding silver.
- Declining oil prices and historic diplomatic progress in the Middle East are easing overall inflation concerns.
Silver price (XAG/USD) declines after two days of gains, trading around $58.10 per troy ounce during the early European hours on Friday. The non-yielding white metal is facing notable challenges amid expectations for tighter Federal Reserve (Fed) monetary policy. According to the CME FedWatch tool, markets are currently pricing in an over 65% chance of a Federal Reserve rate hike in September.
Fed stays resolutely hawkish as Warsh doubles down on 2% target
Warsh’s press conference tone was more hawkish than usual, with the FXS Speechtracker score at 7/10 compared to the established baseline of 6/10, underscoring a firmer commitment to the 2% inflation goal. The emphasis that “inflation cannot be cured in 9 weeks” and that the Committee “will not hesitate to act” signals a willingness to keep policy restrictive for longer, even as Warsh highlights “impressive resilience” in the economy and a solid labor market. Warsh’s insistence that there was a “misimpression” about tolerance for higher inflation and the clear pledge to “deliver the 2% target” reinforce a message that any perceived softening or tolerance for overshooting is off the table, a stance that typically supports the Dollar via higher-for-longer rate expectations.
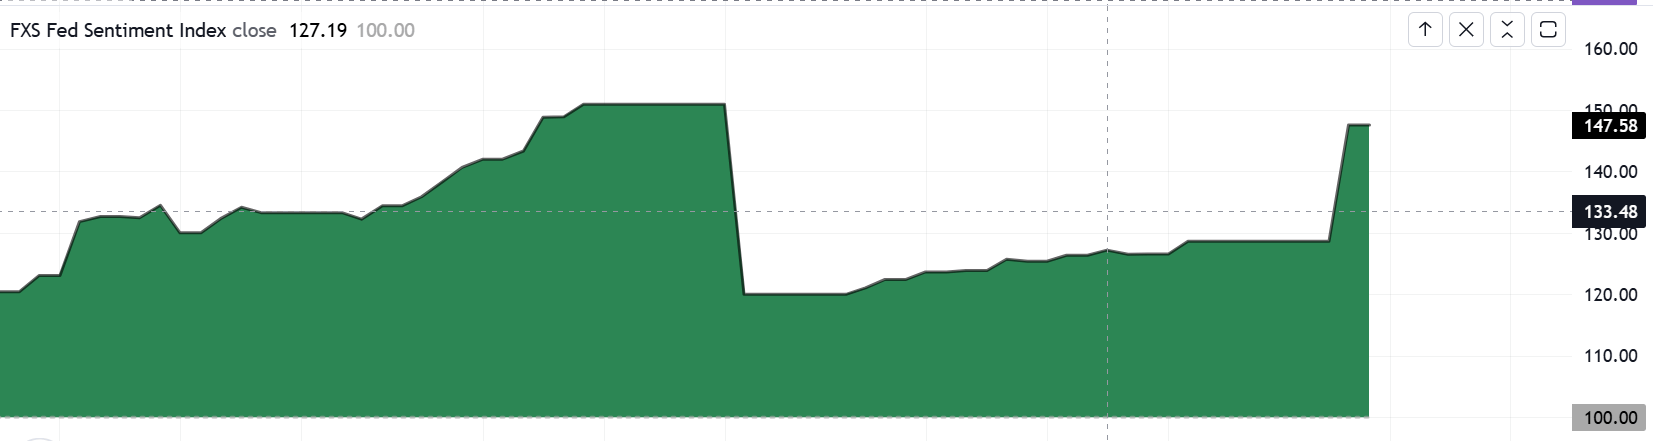
The FXS Fed Sentiment Index jumped by 18.94 points to 147.58, firmly in hawkish territory and consistent with the above-baseline FXS Speechtracker score. A level this elevated signals that, in aggregate, Fed communication is being interpreted as materially more hawkish than neutral, reinforcing upside risks for the Dollar and keeping rate-sensitive assets on alert for further tightening or a prolonged restrictive stance.
The US Dollar Index (DXY), which measures the value of the US Dollar (USD) against six major currencies, is holding gains after two days of losses, trading around 100.20 at the time of writing. Silver struggles as investors face a higher opportunity cost holding it compared to dollar-denominated interest-bearing assets like US Treasury bonds.
Despite these headwinds, the precious metal found some support this week after the US Federal Reserve opted to leave interest rates unchanged, even as mounting inflationary pressures lingered due to renewed hostilities in the Middle East.
However, broader inflation concerns may ease alongside cooling oil prices, driven by positive diplomatic developments. Progress in US-Iran talks aimed at securing the Strait of Hormuz has helped calm energy markets.
Adding to the geopolitical shift, US President Donald Trump announced a historic deal outlining the complete disarmament of Hamas and the withdrawal of Israeli forces from Gaza, a major breakthrough reportedly confirmed by senior Hamas officials.
Silver FAQs
Silver is a precious metal highly traded among investors. It has been historically used as a store of value and a medium of exchange. Although less popular than Gold, traders may turn to Silver to diversify their investment portfolio, for its intrinsic value or as a potential hedge during high-inflation periods. Investors can buy physical Silver, in coins or in bars, or trade it through vehicles such as Exchange Traded Funds, which track its price on international markets.
Silver prices can move due to a wide range of factors. Geopolitical instability or fears of a deep recession can make Silver price escalate due to its safe-haven status, although to a lesser extent than Gold's. As a yieldless asset, Silver tends to rise with lower interest rates. Its moves also depend on how the US Dollar (USD) behaves as the asset is priced in dollars (XAG/USD). A strong Dollar tends to keep the price of Silver at bay, whereas a weaker Dollar is likely to propel prices up. Other factors such as investment demand, mining supply – Silver is much more abundant than Gold – and recycling rates can also affect prices.
Silver is widely used in industry, particularly in sectors such as electronics or solar energy, as it has one of the highest electric conductivity of all metals – more than Copper and Gold. A surge in demand can increase prices, while a decline tends to lower them. Dynamics in the US, Chinese and Indian economies can also contribute to price swings: for the US and particularly China, their big industrial sectors use Silver in various processes; in India, consumers’ demand for the precious metal for jewellery also plays a key role in setting prices.
Silver prices tend to follow Gold's moves. When Gold prices rise, Silver typically follows suit, as their status as safe-haven assets is similar. The Gold/Silver ratio, which shows the number of ounces of Silver needed to equal the value of one ounce of Gold, may help to determine the relative valuation between both metals. Some investors may consider a high ratio as an indicator that Silver is undervalued, or Gold is overvalued. On the contrary, a low ratio might suggest that Gold is undervalued relative to Silver.