


Silver Price Forecasts: XAG/USD hits fresh highs $64.00 as the US Dollar languishes
- Silver consolidates above $64.00 after hitting a fresh all-time high at $64.62.
- Precious metals remain firm on Friday, with the US Dollar depressed.
- Technica indicators suggest that the XAG/USD rally migh be overstretched.
Silver’s (XAG/USD) appreciates for the fourth consecutive day on Friday, consolidating above the $64.00 level at the time of writing after having posted a fresh record high, at $64.62 earlier on the day.
Precious metals remain on a strong footing in a calm market session on Friday, with the US Dollar Index (DXY) pinned near two-month lows. The Fed’s monetary policy stance released on Wednesday has not altered investors’ bets for at least 50 basis points of further rate cuts over the next year, keeping the Greenback under pressure.
Technical Analysis: Silver has reached overbought levels
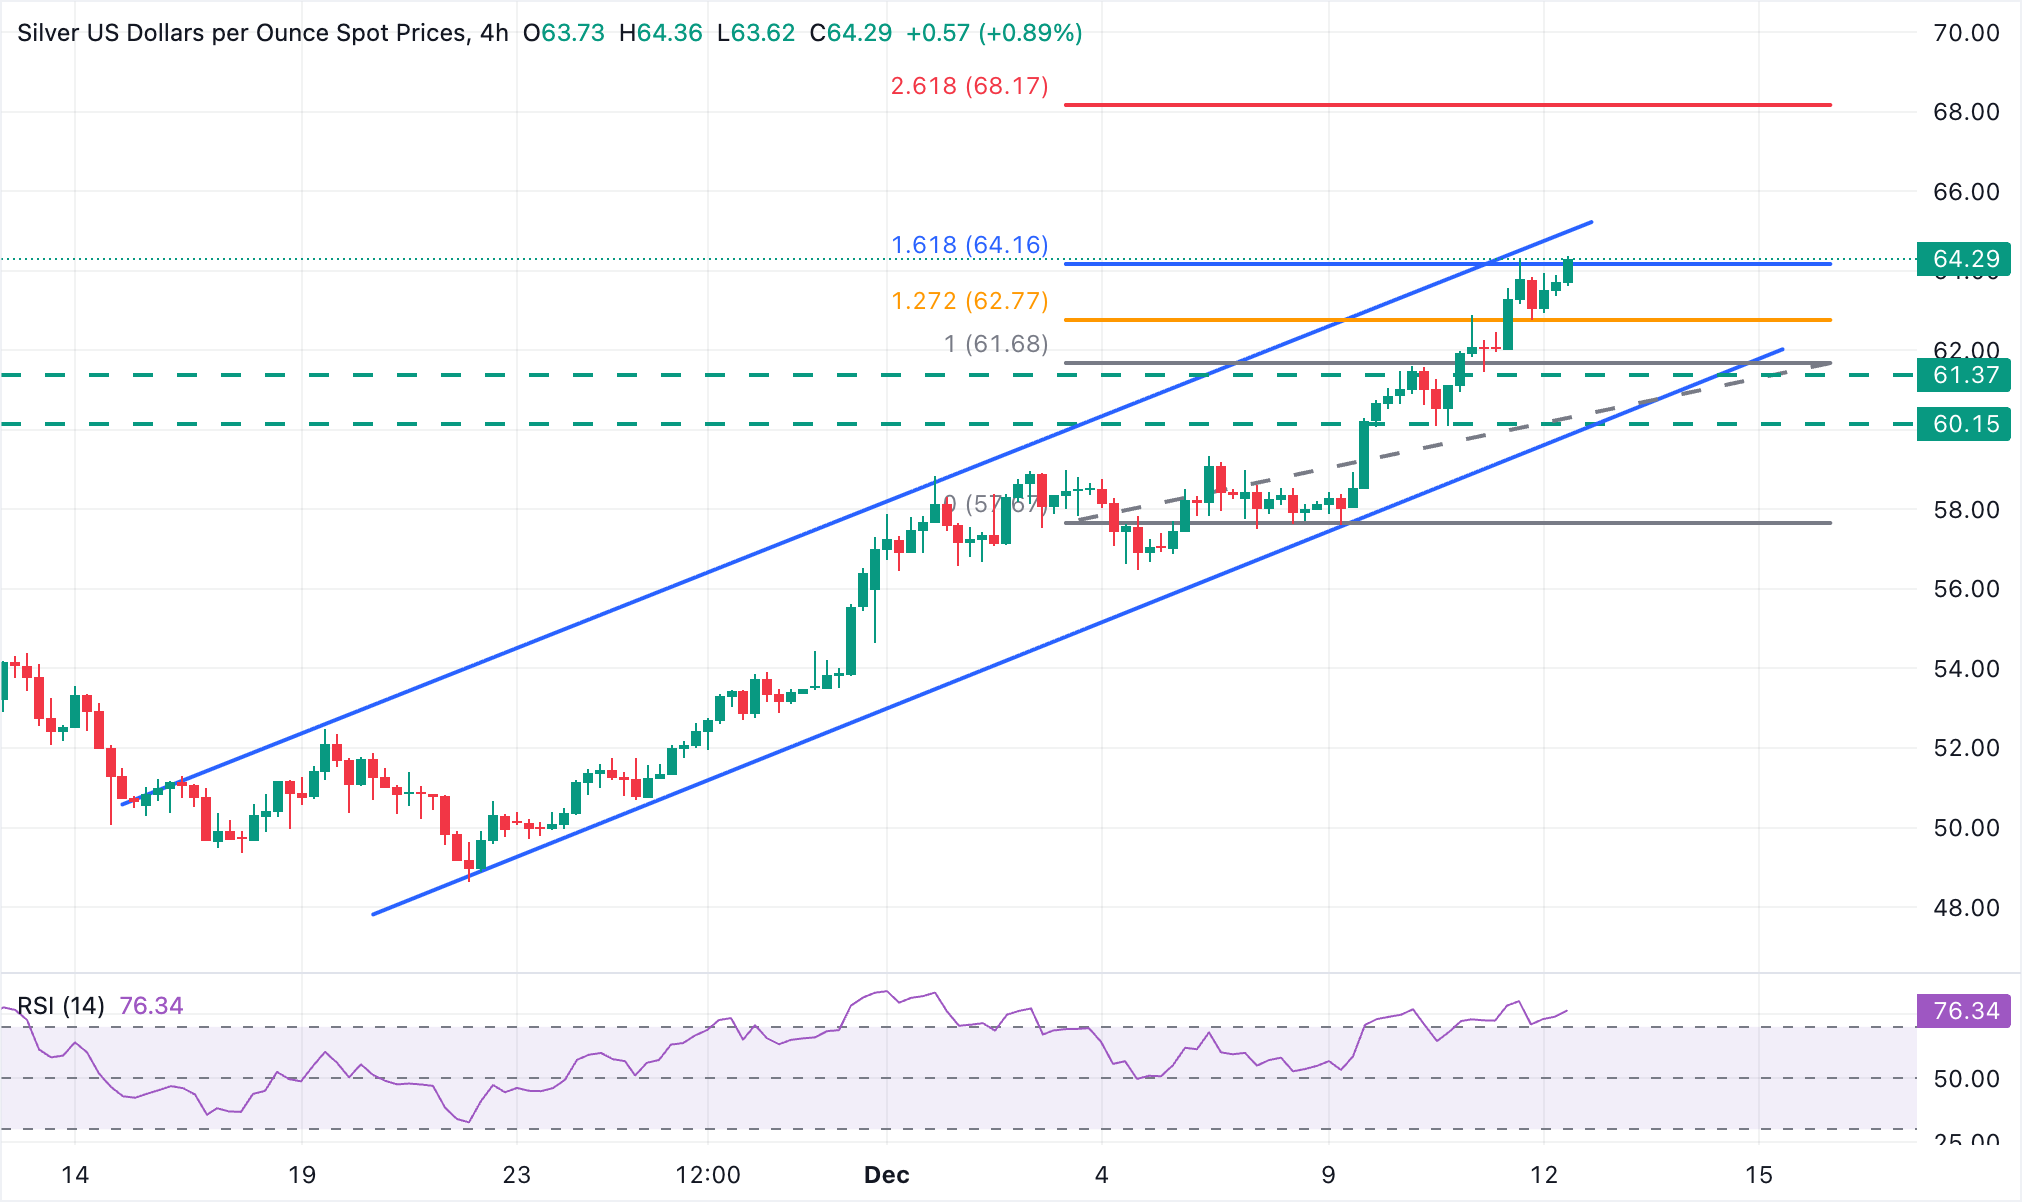
The pair looks overstretched after rallying more than 25% in the last three weeks. The 4-hour Relative Strength Index (RSI) is at 75, highlighting a bearish divergence, which should act as a warning for buyers. Price action, however, is not showing signs of a trend change so far.
Silver is struggling to consolidate above $64.00 at the moment of writing, with the next upside target at the mentioned $64.62 session high, and the top of the ascending channel, right above $65.00. Further up, the 261.8% Fibonacci extension of the December 9-10 uptrend is at $68.17.
Thursday’s
To the downside, the pair has found support at the $62.80 intraday level, with the next bearish target at Thursday’s low of $61.44. Further down, the confluence between the December 10 low, near $60.00, and the bottom of the ascending channel, now around $59.85, is a key area for bears.
Silver FAQs
Silver is a precious metal highly traded among investors. It has been historically used as a store of value and a medium of exchange. Although less popular than Gold, traders may turn to Silver to diversify their investment portfolio, for its intrinsic value or as a potential hedge during high-inflation periods. Investors can buy physical Silver, in coins or in bars, or trade it through vehicles such as Exchange Traded Funds, which track its price on international markets.
Silver prices can move due to a wide range of factors. Geopolitical instability or fears of a deep recession can make Silver price escalate due to its safe-haven status, although to a lesser extent than Gold's. As a yieldless asset, Silver tends to rise with lower interest rates. Its moves also depend on how the US Dollar (USD) behaves as the asset is priced in dollars (XAG/USD). A strong Dollar tends to keep the price of Silver at bay, whereas a weaker Dollar is likely to propel prices up. Other factors such as investment demand, mining supply – Silver is much more abundant than Gold – and recycling rates can also affect prices.
Silver is widely used in industry, particularly in sectors such as electronics or solar energy, as it has one of the highest electric conductivity of all metals – more than Copper and Gold. A surge in demand can increase prices, while a decline tends to lower them. Dynamics in the US, Chinese and Indian economies can also contribute to price swings: for the US and particularly China, their big industrial sectors use Silver in various processes; in India, consumers’ demand for the precious metal for jewellery also plays a key role in setting prices.
Silver prices tend to follow Gold's moves. When Gold prices rise, Silver typically follows suit, as their status as safe-haven assets is similar. The Gold/Silver ratio, which shows the number of ounces of Silver needed to equal the value of one ounce of Gold, may help to determine the relative valuation between both metals. Some investors may consider a high ratio as an indicator that Silver is undervalued, or Gold is overvalued. On the contrary, a low ratio might suggest that Gold is undervalued relative to Silver.