NZD/USD Price Analysis: Comes closer to 0.6000 ahead of US NFP
- NZD/USD moves higher to 0.5980 as US Dollar remains on backfoot ahead of US economic data.
- The US NFP will influence speculation for Fed rate cuts, which are expected in September.
- NZ’s steady Labor Cost Index growth boosts expectations of the RBNZ delaying rate cuts.
The NZD/USD pair extends its two-day winning spell on Friday as the US Dollar hits a fresh three-week low ahead of the United States Nonfarm Payrolls (NFP) and the ISM Services PMI report for April, which will be published in the New York session.
The economic indicators will exhibit the current status of labor demand and economic health, which will be Federal Reserve (Fed) for decision-making on interest rates. This will also drive the speculation about when the Fed will start reducing interest rates. Currently, investors expect that the Fed will start reducing interest rates from the September meeting.
The consensus shows that US nonfarm employers hired 243K job-seekers, lower than robust joining of 303K payrolls in March. Investors will also focus on the Average Hourly Earnings, which is a leading indicator of wage growth that reflects the inflation outlook. The Services PMI is forecasted to have improved to 52.0 from the prior reading of 51.4.
Meanwhile, the New Zealand Dollar strengthens as the Reserve Bank of New Zealand (RBNZ) is expected to start reducing interest rates later this year. The Labor Cost Index data, which reflects wage growth and influence the consumer spending grew in line with estimates in the first quarter this year. This has boosted expectations for the RBNZ delaying rate cuts later this year.
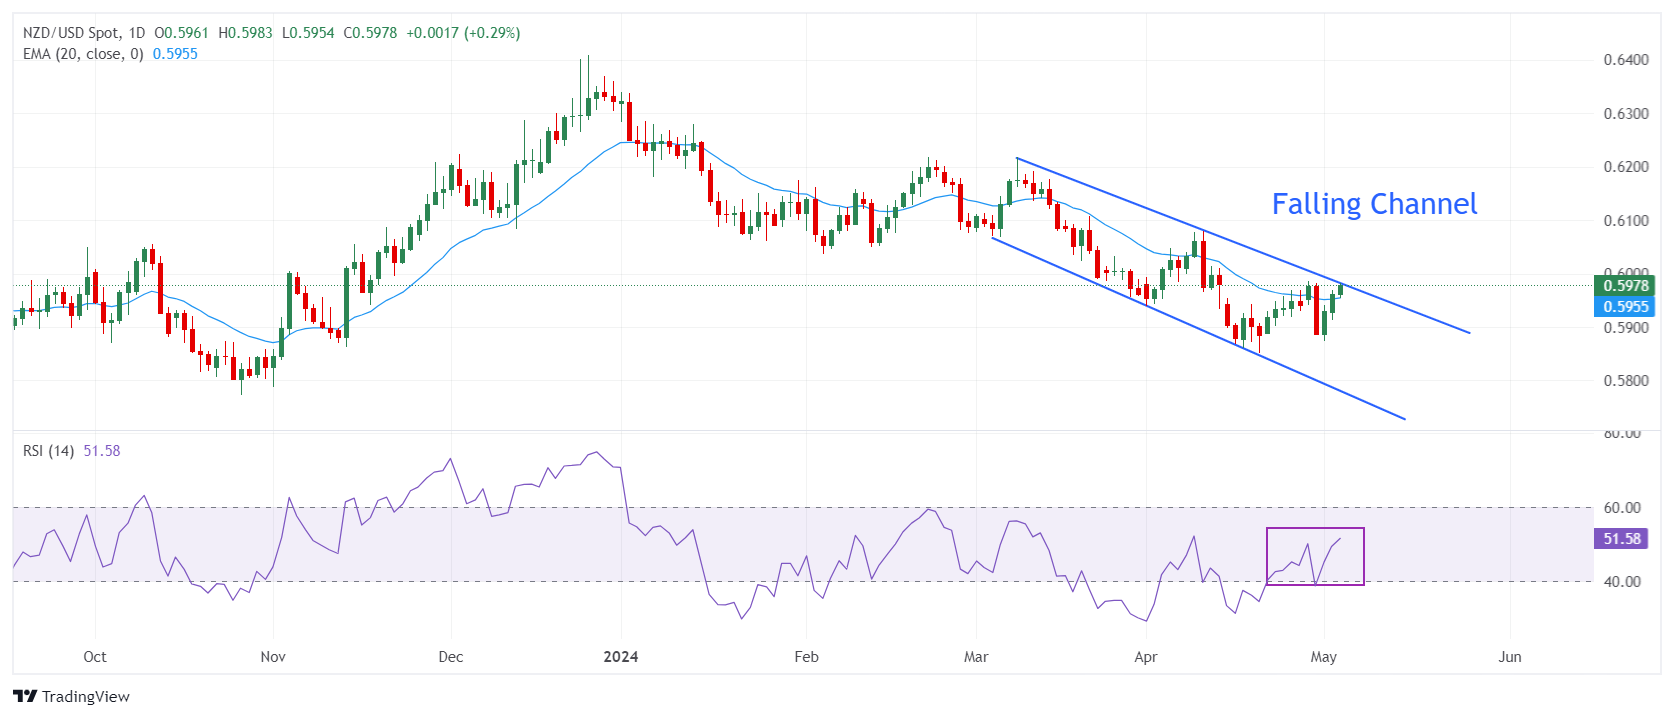
NZD/USD rises to the upward border of the Falling Channel formation on a daily timeframe. The Kiwi asset is at a make or a break near 0.5980 as momentum oscillators exhibit signs of a bullish reversal while a pullback move to the upward border of the above-mentioned chart pattern emerges as a selling opportunity for the market participants knowing that the broader trend is still bearish.
The 14-Relative Strength Index (RSI) rebounds from 40.00, which indicates that the trend is not bearish anymore.
The near-term outlook of the asset improves as it holds above the 20-day Exponential Moving Average (EMA), which trades around 0.5954.
An upside above the psychological resistance of 0.6000 will drive the asset towards April 4 high around 0.6050 and the round-level resistance of 0.6100.
On the contrary, fresh downside would appear if the asset breaks below April 16 low at 0.5860. This would drag the asset toward 8 September 2023 low at 0.5847, followed by the round-level support of 0.5900.
NZD/USD daily chart


