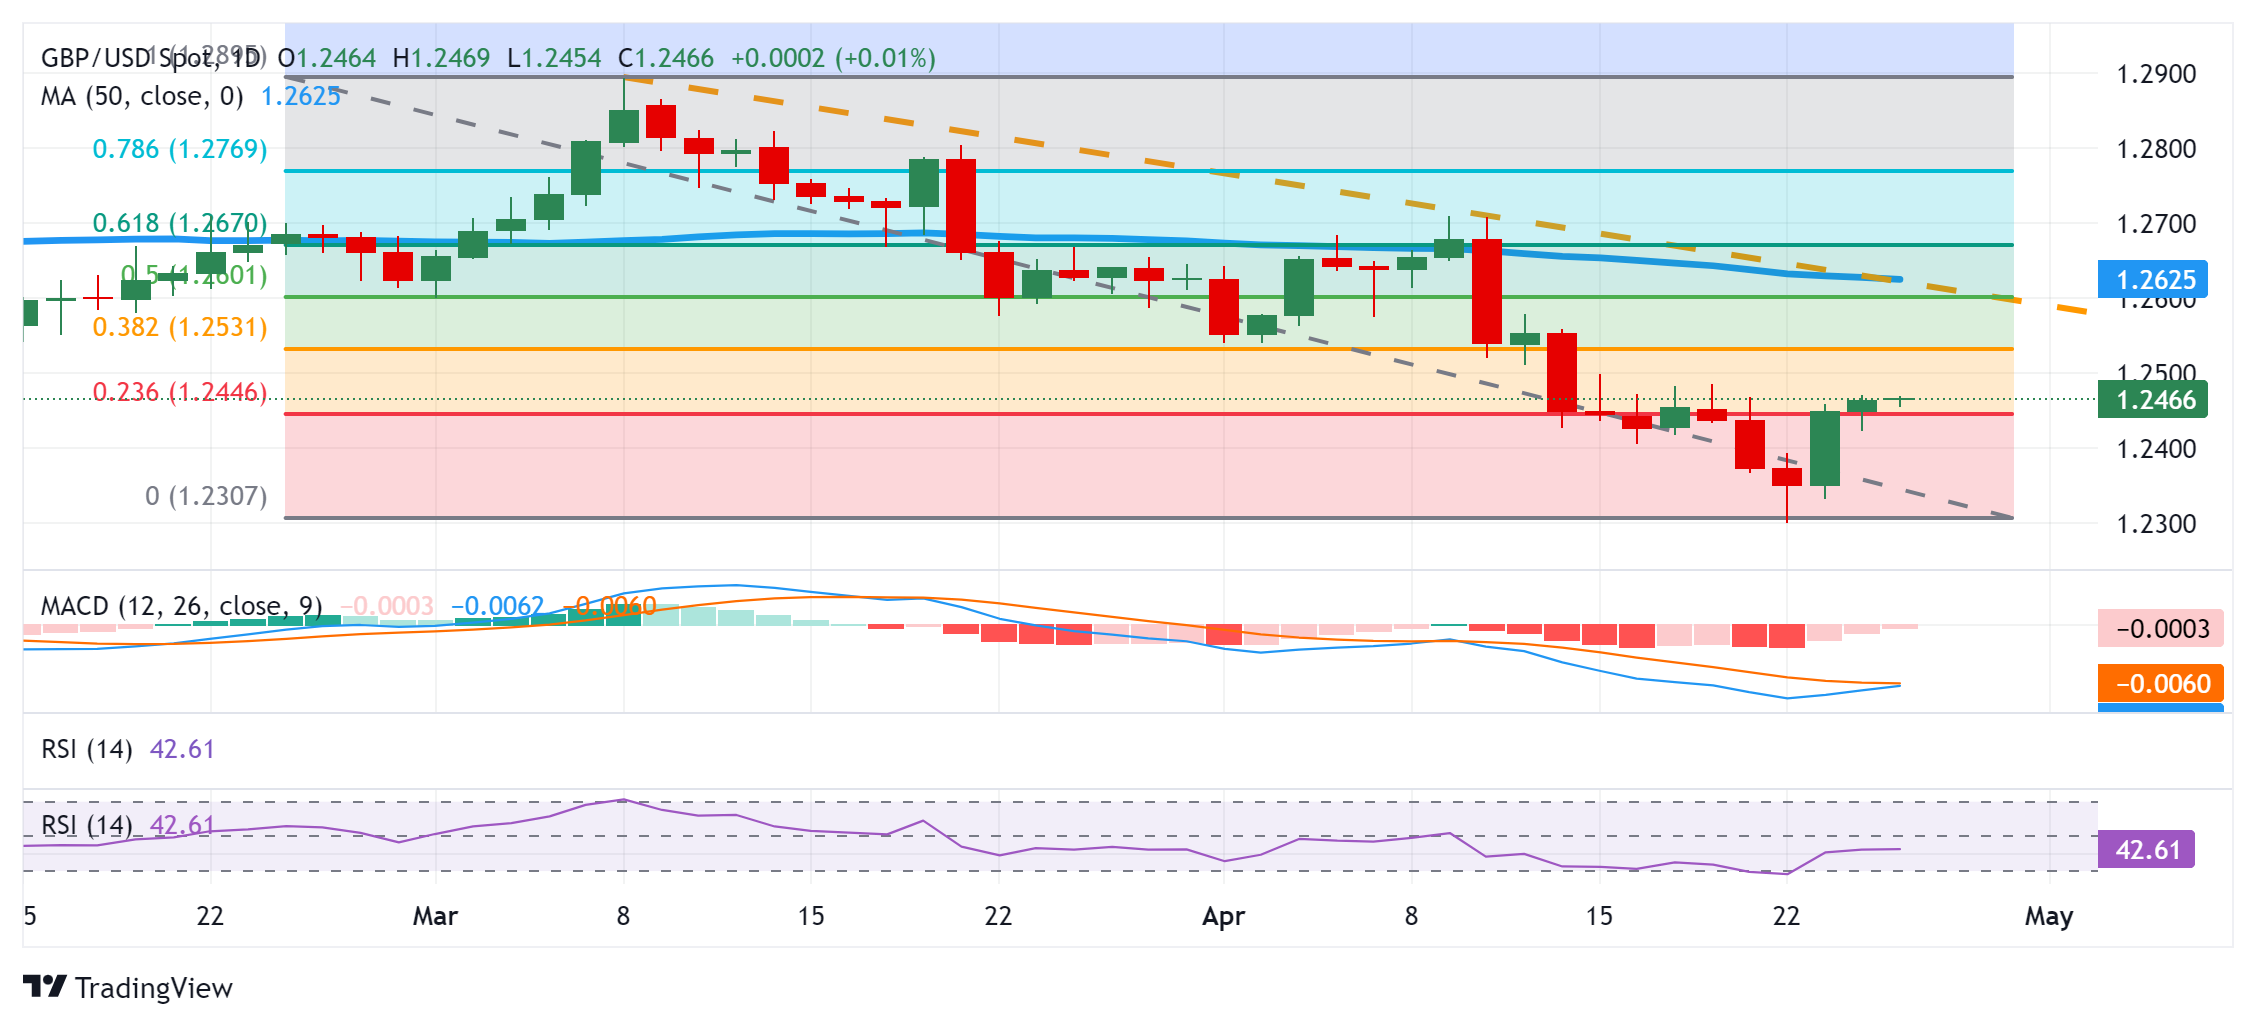
GBP/USD Price Analysis: Acceptance above 23.6% Fibo. favors bulls ahead of US Q1 GDP
- GBP/USD struggles to attract follow-through buying and trades in a narrow range on Thursday.
- Reduced Fed rate cut bets and speculations about more aggressive BoE easing act as a headwind.
- The technical setup warrants some caution before positioning for any further appreciating move.
The GBP/USD pair consolidates its strong recovery gains registered over the past two days, from the 1.2300 mark or the YTD low set earlier this week and oscillates in a range during the Asian session on Thursday. Spot prices currently trade near the 1.2465 region, unchanged for the day as traders await more cues about the Federal Reserve's (Fed) rate-cut path before placing fresh directional bets.
Hence, the focus will remain glued to important US macro data – the Advance Q1 GDP report later today and the Personal Consumption Expenditures (PCE) Price Index on Friday. In the meantime, expectations that the Fed will delay cutting interest rates in the wake of sticky inflation continue to act as a tailwind for the US Dollar (USD). Apart from this, speculations about more aggressive policy easing by the Bank of England (BoE) undermine demand for the British Pound (GBP) and act as a headwind for the GBP/USD pair.
From a technical perspective, acceptance above the 23.6% Fibonacci retracement level of the March-April downfall favors bullish traders and supports prospects for a further appreciating move. Hence, some follow-through strength beyond the 1.2500 psychological mark, en route to the 1.2530-1.2535 region or the 38.2% Fibo. level, looks like a distinct possibility. That said, oscillators on the daily chart are still holding in the negative territory, suggesting that the latter should act as a headwind and cap the upside for the GBP/USD pair.
On the flip side, the 1.2425 area now seems to protect the immediate downside ahead of the 1.2400 round figure. Some follow-through selling could drag the GBP/USD pair back towards the 1.2350 intermediate support en route to the 1.2300 mark, or the YTD low touched on Tuesday. A convincing break below the latter will be seen as a fresh trigger for bearish traders and pave the way for an extension of the recent downtrend from the March swing high. Spot prices might then slide to the 1.2245 area before dropping to the 1.2200 mark.
GBP/USD daily chart


