


Silver Price Analysis: XAG/USD dives towards the 50-DMA, forming a bearish-engulfing candle pattern
- Silver price is upward biased from a monthly chart perspective.
- In the weekly chart, XAG/USD remains below its 200-week EMA, downward biased.
- XAG/USD daily chart illustrates silver as neutral-to-downwards, though a bearish-engulfing candle pattern suggests a leg-down is on the cards.
Silver price edges lower during Monday’s North American session, down by 2.40% courtesy of US dollar strength, despite falling US Treasury bond yields, ahead of the release of the last FOMC monetary policy minutes. At the time of writing, the XAG/USD formed a bearish-engulfing candle pattern, trading at $20.23.
Silver Price Analysis (XAG/USD): Technical outlook
The white metal outlook looks more positive than negative from a monthly chart perspective. July’s price action formed a dragonfly-doji in a crowded area with the 50, 100, and 200-monthly MAs lying around the $18.48-$20.17 region, which could pave the way for further gains. On the topside, the 20-month EMA at $23.81 might cap further XAG/USD gains.
 XAG/USD Monthly chart
In the meantime, the XAG/USD weekly chart portrays the non-yielding metal struggling at the 200-week MA, at $20.60. Nevertheless, unless sellers push silver below $19.80, buyers could remain hopeful of higher prices, though they would face a wall of resistance at around $21.48, the 20-week EMA. Once cleared, it would pave the way towards the 50-week EMA at $22.73, ahead of the 100-week at $24.11.
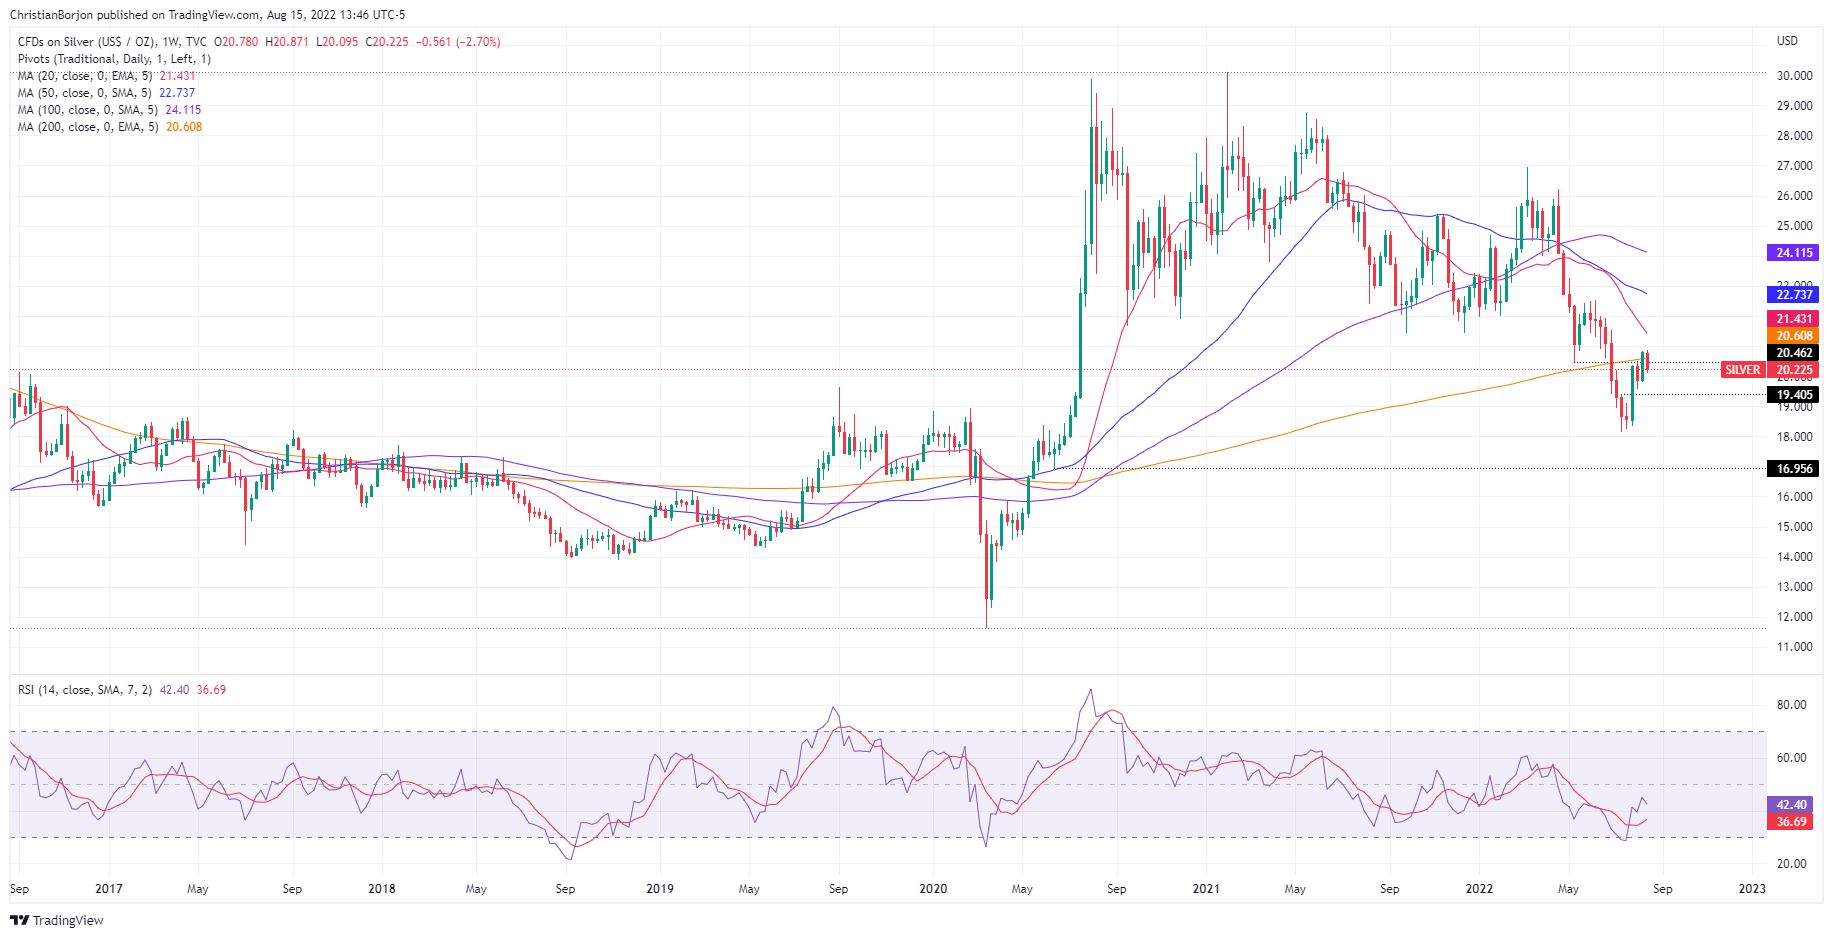 XAG/USD Weekly chart
The XAG/USD daily chart portrays silver as neutral-to-downwards biased. As previously mentioned, a bearish-engulfing candle pattern surfaced. Still, the 50-day EMA at $20.18 is a difficult support level to overcome for sellers, but the Relative Strength Index (RSI) aiming lower, towards the 50-midline, might open the door for further losses.
If XAG/USD sellers achieve a daily close below the above-mentioned, the XAG/USD next support would be the $20.00 figure, which, once cleared, could test the 20-day EMA at $19.73. On the flip side, if XAG/USD buyers hold the fort above the former, then the XAG/USD first resistance would be the $21.00 figure. Break below will expose crucial resistance levels, like the 50-day EMA at $21.68, followed by the 200-day EMA at $22.68.
 XAG/USD Daily chart
Silver (XAG/USD) Key Technical Levels