NZD/USD holds gains following Fed’s decision
- The Fed acknowledged no significant progress towards the 2% inflation goal, maintaining a hawkish stance.
- Despite challenges, Powell notes restrictive policies have moderated inflation and that risks to dual goals are more balanced.
- Markets are giving up the hopes of three rate cuts in 2024.
The NZD/USD found some momentum after the widely-anticipated Federal Reserve (Fed) decision which announced yet another hold, leaving rates at the 5.25-5.50% range. Powell’s cautious tone and data dependency were taken as dovish by markets which made investors dump the USD.
In addition, Powell stated that the bank still needs additional evidence to gain confidence to start cutting rates, noting that inflation’s progress stagnated in the last months. He confirmed that in case data continues to come strong, it would be appropriate to hold the restrictive police for some more time. When the data started to align with the bank’s forecast, he pointed out that he would consider cutting rates.
Regarding expectations, markets are giving up hopes of a cut in June and July and are pushing the start of the easing to September or even November.
NZD/USD technical analysis
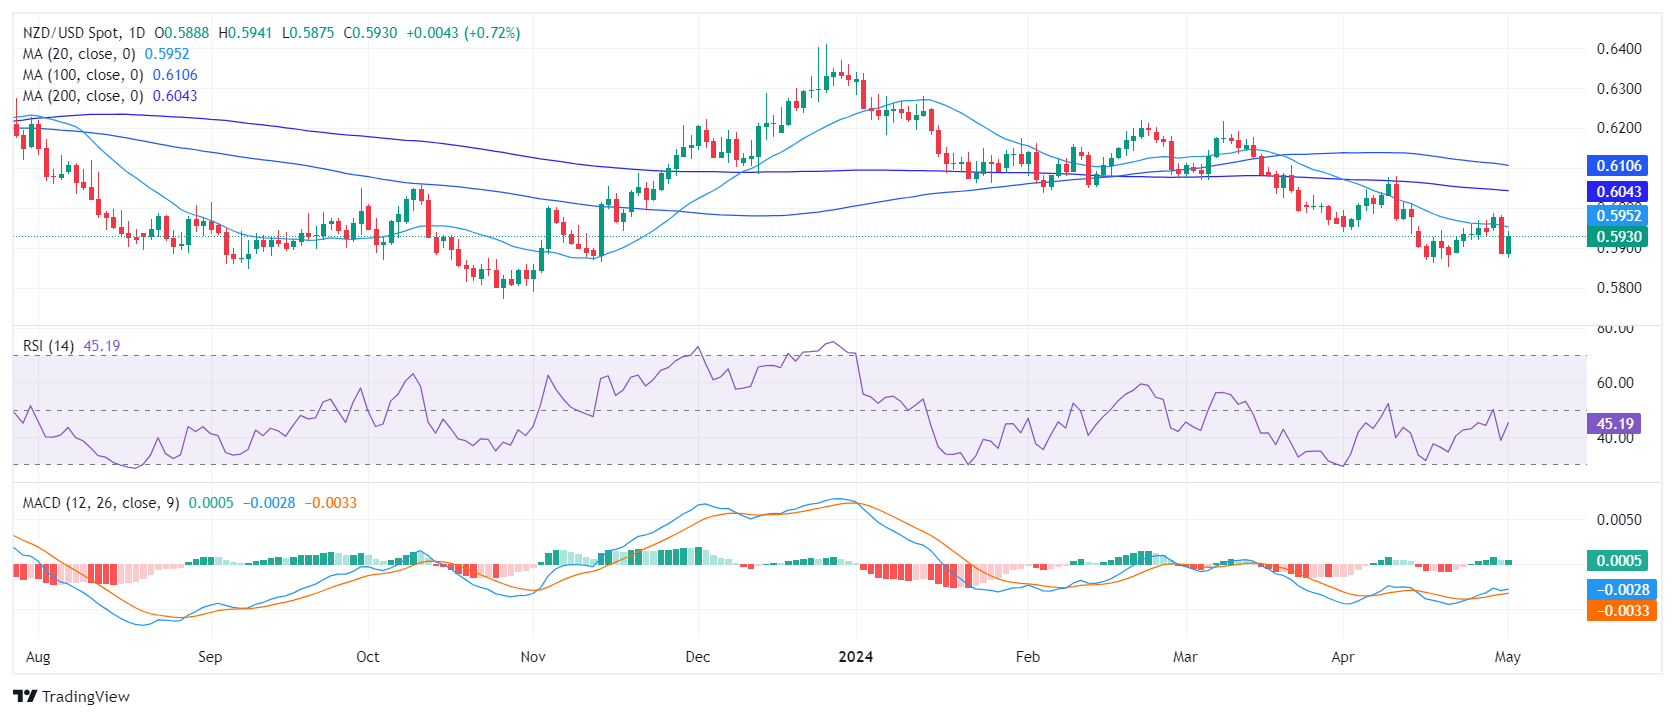
On the daily chart, the Relative Strength Index (RSI) stands in negative territory. The recent readings note an uptick to 44 which shows some light for the bulls but that they remain beneath the positive line. In addition, the Moving Average Convergence Divergence (MACD) histogram marks flat green bars, indicating a slight positive momentum.
NZD/USD daily chart

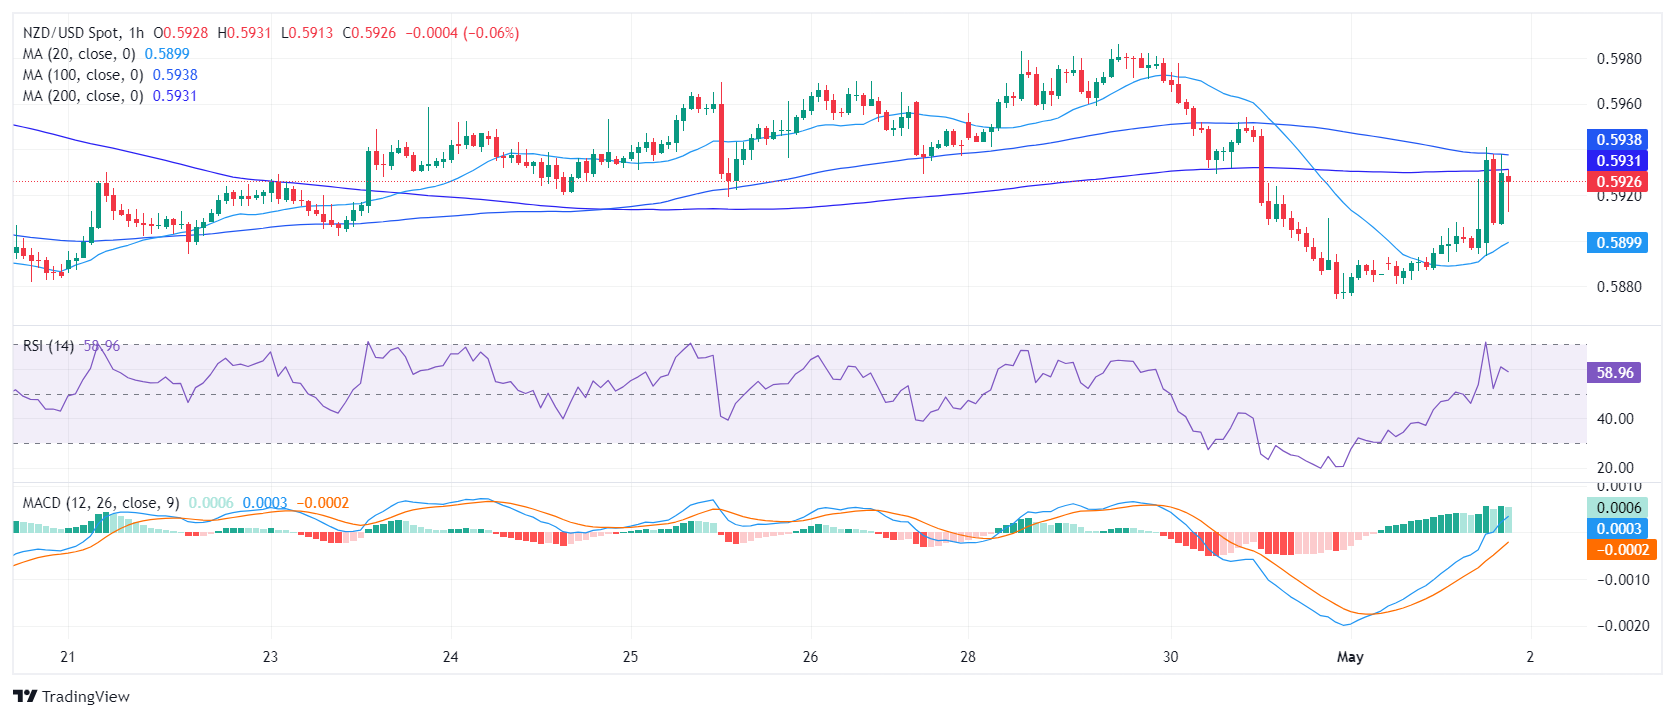
Shifting to the hourly chart display, the RSI shows diverse readings with an overbought condition at 70 followed by a drop to 55. Concurrently, the hourly MACD charts flat green bars, similar to the daily forecast, hinting at prospective positive impulse in the short-term.
NZD/USD hourly chart

In assessing the wider picture, the NZD/USD is under significant downward pressure as it is currently positioned below the 20, 100, and 200-day Simple Moving Averages (SMAs).
Overall, the NZD/USD exhibits a mixed picture. Despite an hourly overbought signal tempering prospective bearish conditions, the key SMAs, coupled with the daily RSI readings, lean towards the bearish side, deprecating the NZD/USD pair. Current conditions suggest that sellers may continue to dominate, particularly as the pair trails below the important SMAs but buyers might make another stride at the 20-day SMA at 0.5950 which could brighten the outlook.


